United States by Carbon Emissions per capita (2000-2014)
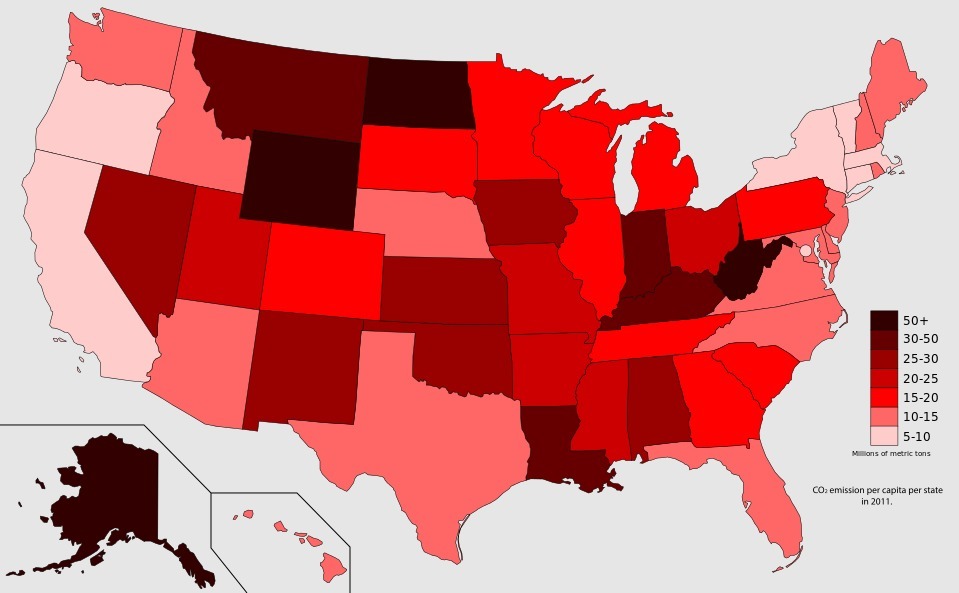
3D map of the United States showing carbon emissions per capita based on data ranging between 2000-2014.
Data gathered from: https://www.eia.gov/environment/emissions/state/analysis/
Customized version of http://www.thingiverse.com/thing:209005
Created with Customizer! http://www.thingiverse.com/apps/customizer/run?thing_id=209005
Part of United Stats of America collection https://www.thingiverse.com/danowall/collections/united-stats-of-america